Chapter 3 Data transformation
We aim at merging all data into one tidy master data frame within which each observation will correspond to one country and one year.
3.1 Selecting the time range
We hope to keep a sufficiently wide range so as to observe clear change in energy consumption behavior across time, while at the same time reducing missing data for as many countries as possible.
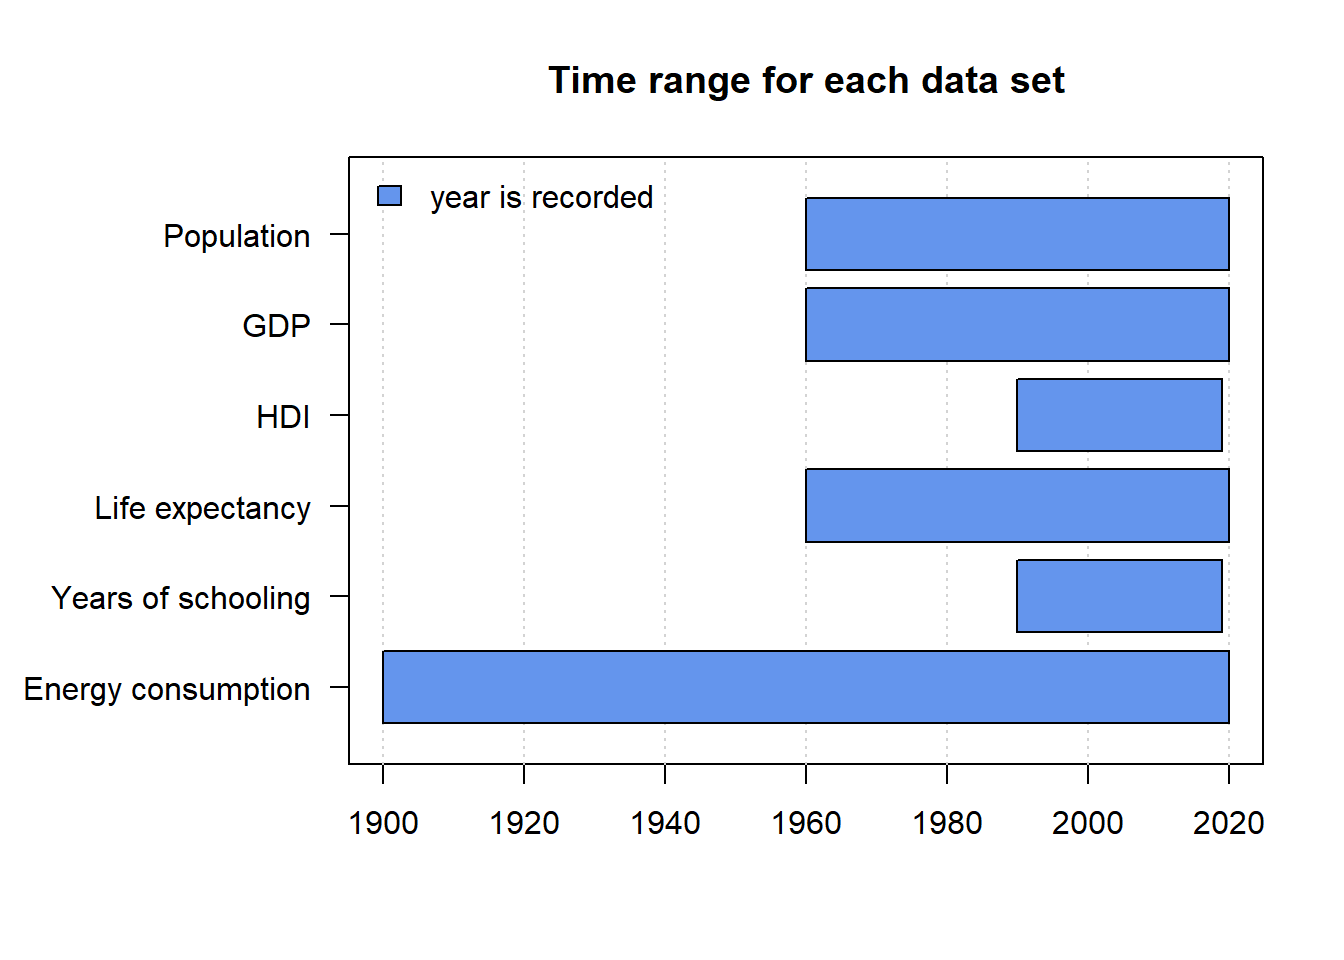
We choose to restrict our multivariate analysis to the narrowest time range. This is exactly the intersection of all ranges : 1990-2019.
We note that this plot does not tell us anything about missing values. Indeed, a given observation might be missing although within the time range of the data set.
3.2 Selecting the variables
We hope to be able to analyze and understand the cross-correlation between energy consumption and human development. To do so, we need the following:
- Data indicators for HDI and all its major components, namely:
GDP,life_expectancy,years_of_schooling; - Figures for consumption per energy type;
- Population data and other country indicators like geographic region.
3.3 Data transformation procedure
Our data transformation works as follows.
- Determine the needed variables from the respective datasets
- Create dataframes for each of the datasets that only contains the needed variables and time frames to avoid having an unnecessarily large final dataframe that would slow down analyses
- Energy data
- GDP data
- Life expectancy data
- Schooling data
- Population data
- HDI data
- Filter the dataframes on common ISO codes (unique identifiers for countries) such that only countries for which all dataframes match up are selected. We find that there is little to no variance in the countries from the different datasets but that some include geographic regions that are filtered by this procedure as they do not have ISO codes.
- Convert previously wide dataframes into a long format such that each row is one unique observation of country and year
- Merge all dataframes on their ISO code and year
- Add the country names from the library
countrycodebased on the ISO codes to guarantee a common naming scheme and simplify interpretation.
We use the resulting master_df as our database in all further analyses. Of course, we sometimes have to modify or calculate new variables based on the current question.
| variable | dataset |
|---|---|
| ISO_code | worldbank_country_info |
| HDI | HDI |
| population | population |
| years_of_schooling | un_years_of_schooling |
| life_expectancy | life_expectancy |
| GDP | worldbank_gdp |
| fossil_fuel | owid_energy_data |
| hydro | owid_energy_data |
| low_carb | owid_energy_data |
| nuclear | owid_energy_data |
| other_renew | owid_energy_data |
| renew | owid_energy_data |
| solar | owid_energy_data |
| wind | owid_energy_data |
| coal | owid_energy_data |
| gas | owid_energy_data |
| oil | owid_energy_data |
| biofuel | owid_energy_data |
| primary | owid_energy_data |