Chapter 5 Results
5.1 Cross directional causality between energy consumption (EC), GDP and years of schooling (YOS)
The acronyms EC, GDP and YOS will be used to refer to energy consumption, gross domestic product and years of schooling respectively.
Energy consumption fuels economic prosperity
Analyzing the impact of energy consumption on GDP and mean years of schooling is not that easy as the three variables suffer from cross directional causality. The intuition suggests a high correlation between energy consumption and GDP. Indeed, most economies are highly energy dependent and many production and consumption activities involve energy as a central input.
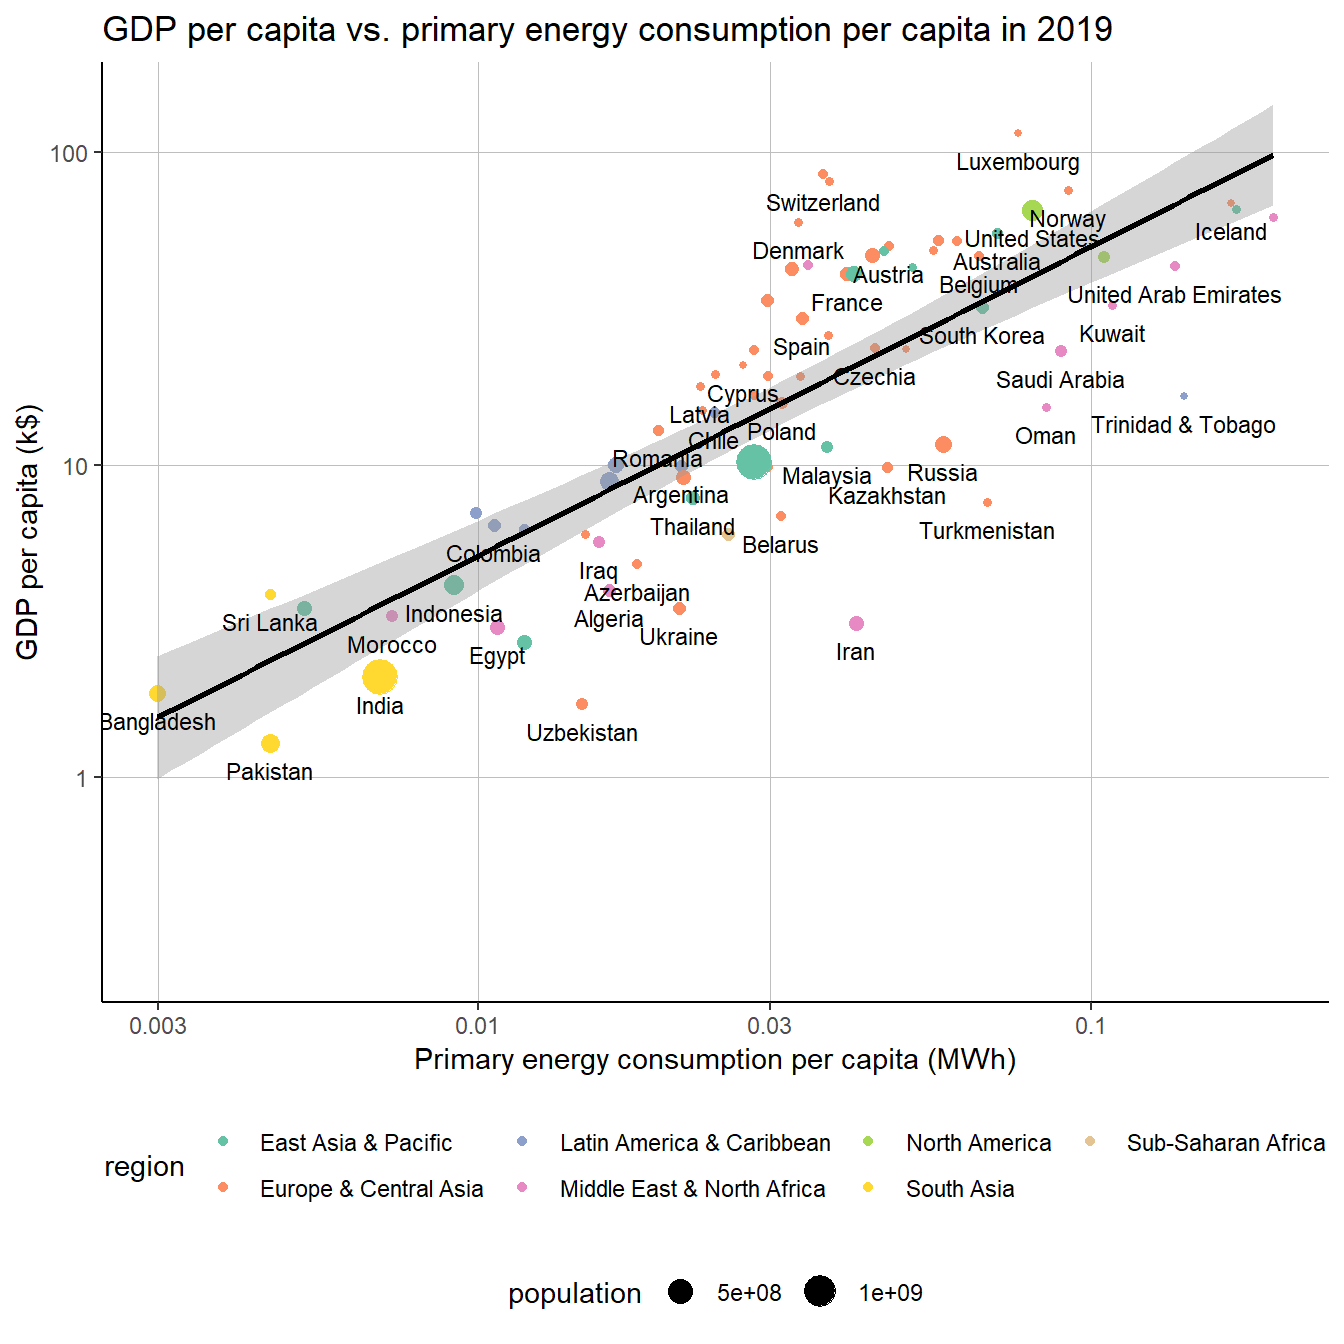
This graph emphasizes the intuitive idea that energy is required to stimulate growth. More consumption generally results in an increase in the economic output.
Parallel increase of EC and YOS in economic growth
As a country benefits from economic prosperity with a higher GDP per capita, this one might allocate more resources to education to foster the formation of human capital. This would enhance the schooling system and lead to the increase of the mean year of schooling for a given cohort.
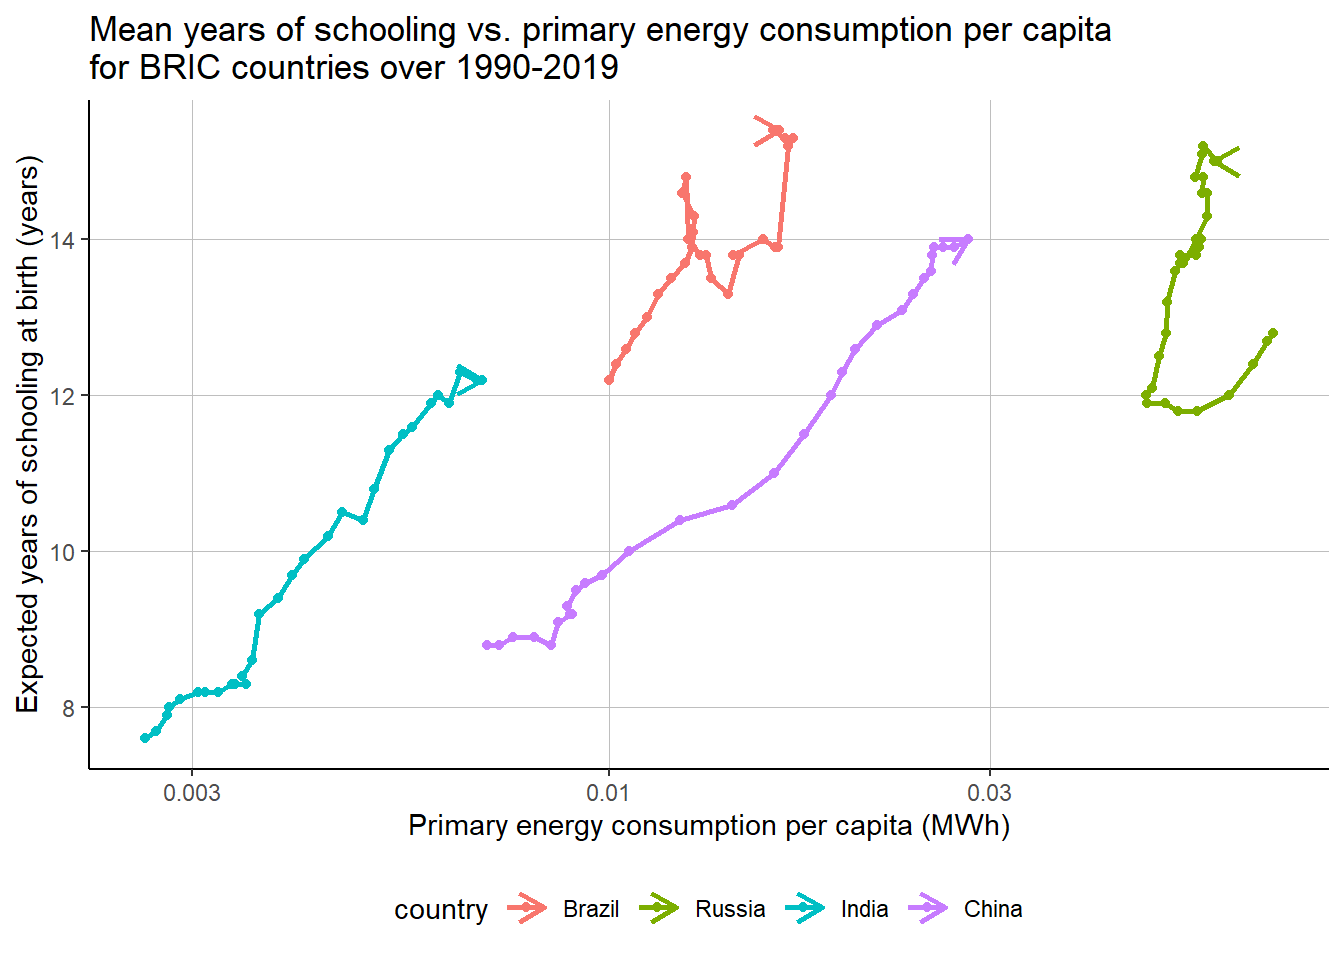
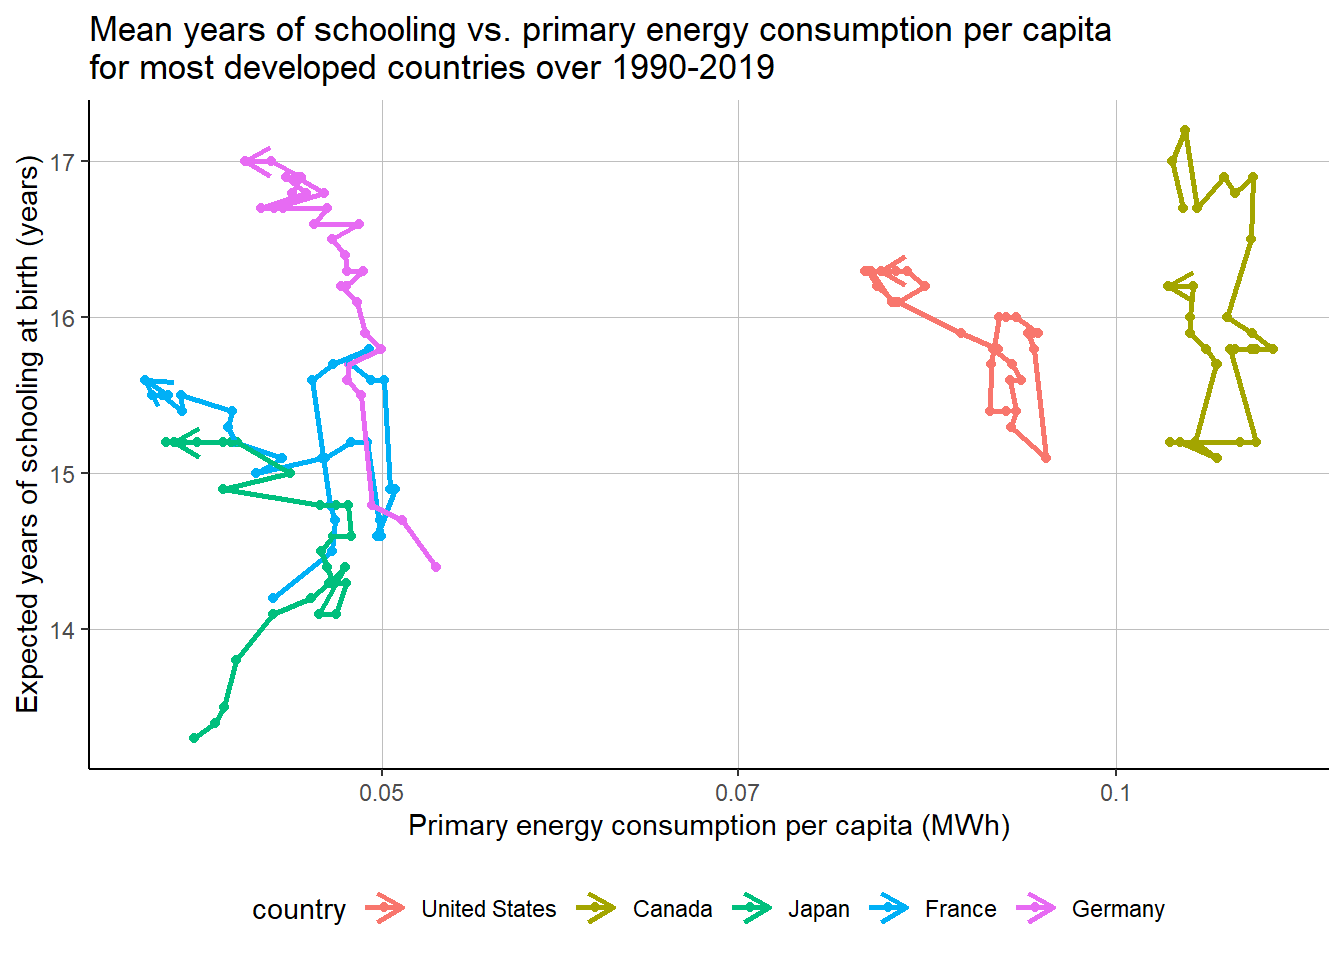
The path towards economic maturity consists of a simultaneous rise of energy consumption and mean years of schooling. To become more productive, a country invests in education in order for its proportion of educated workers to increase. On the plot just above, we notice that the expect years of schooling seems to converge towards a value between 15 and 17 years, value that we observe for mature countries.
5.2 Co-movement of energy consumption and HDI
An overview of HDI in the world
From the available data, we observe high variability of the human development index. It ranges from the highest values in Europe, North America, Oceania and Japan to the lowest in central Africa.
Segmented analysis of HDI
The increase of energy consumption of a population generally tends to affect its way of living. The intuition suggests that, in the long-term, consuming more energy is correlated with an improvement of the the human development of a population and hence, an increase of the HDI.
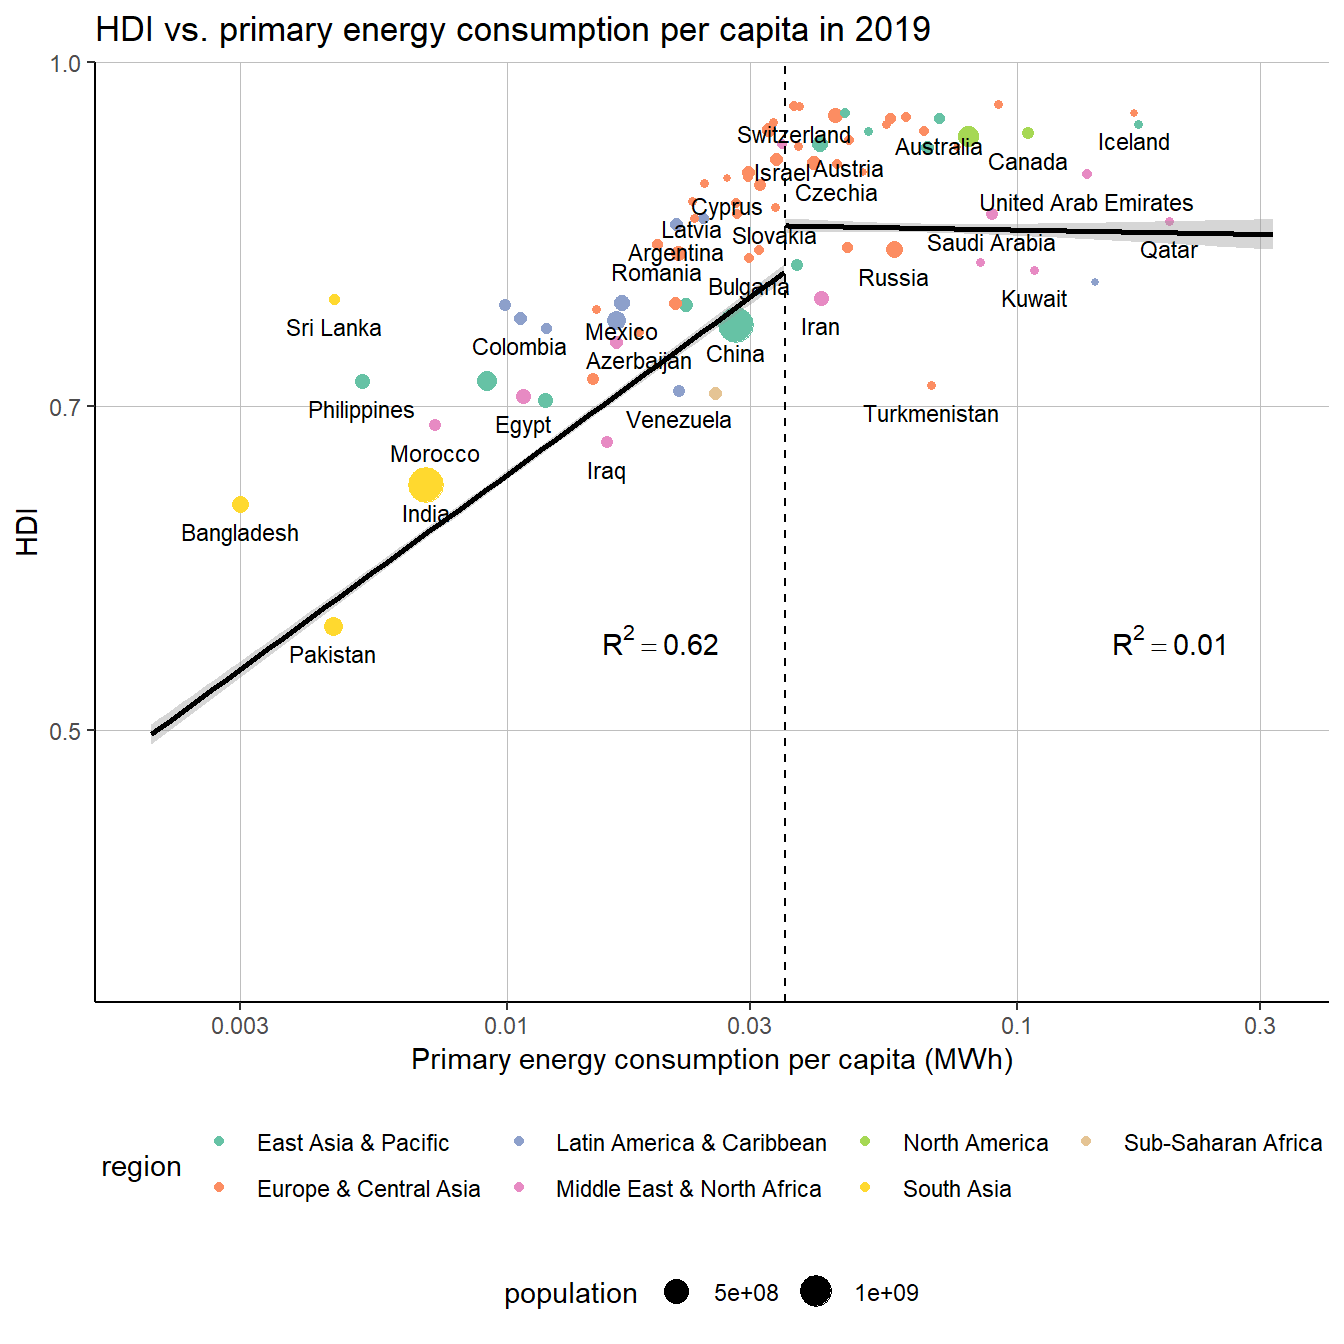
There seems to be a threshold of energy consumption per capita which separates two types of HDI behaviors. For countries with low level of energy consumption, the causal relationship between energy consumption and HDI is very strong, as suggested by the high value of \(R^2\). By contrast, there does not seem to be a correlation for countries with high level of energy consumption. Intuitively, the investments made by a country on the verge of becoming wealthier will generally have a much larger effect on human development (health system, education).
5.3 Association of human development and renewable energy
(Disclaimer: There is no data on renewable energy available for 91/169 countries. These countries are mainly in Africa and/or low-income countries and thus limit the analysis for these areas.)
The earlier analysis of GDP and energy consumption shows that economic growth, energy consumption, and human development are correlated until a threshold on the economic growth is reached. Considering the growing importance of renewable energy and the negative effects fossil energy sources can have on human livelihood, we must understand the relation of renewable energy and human development.
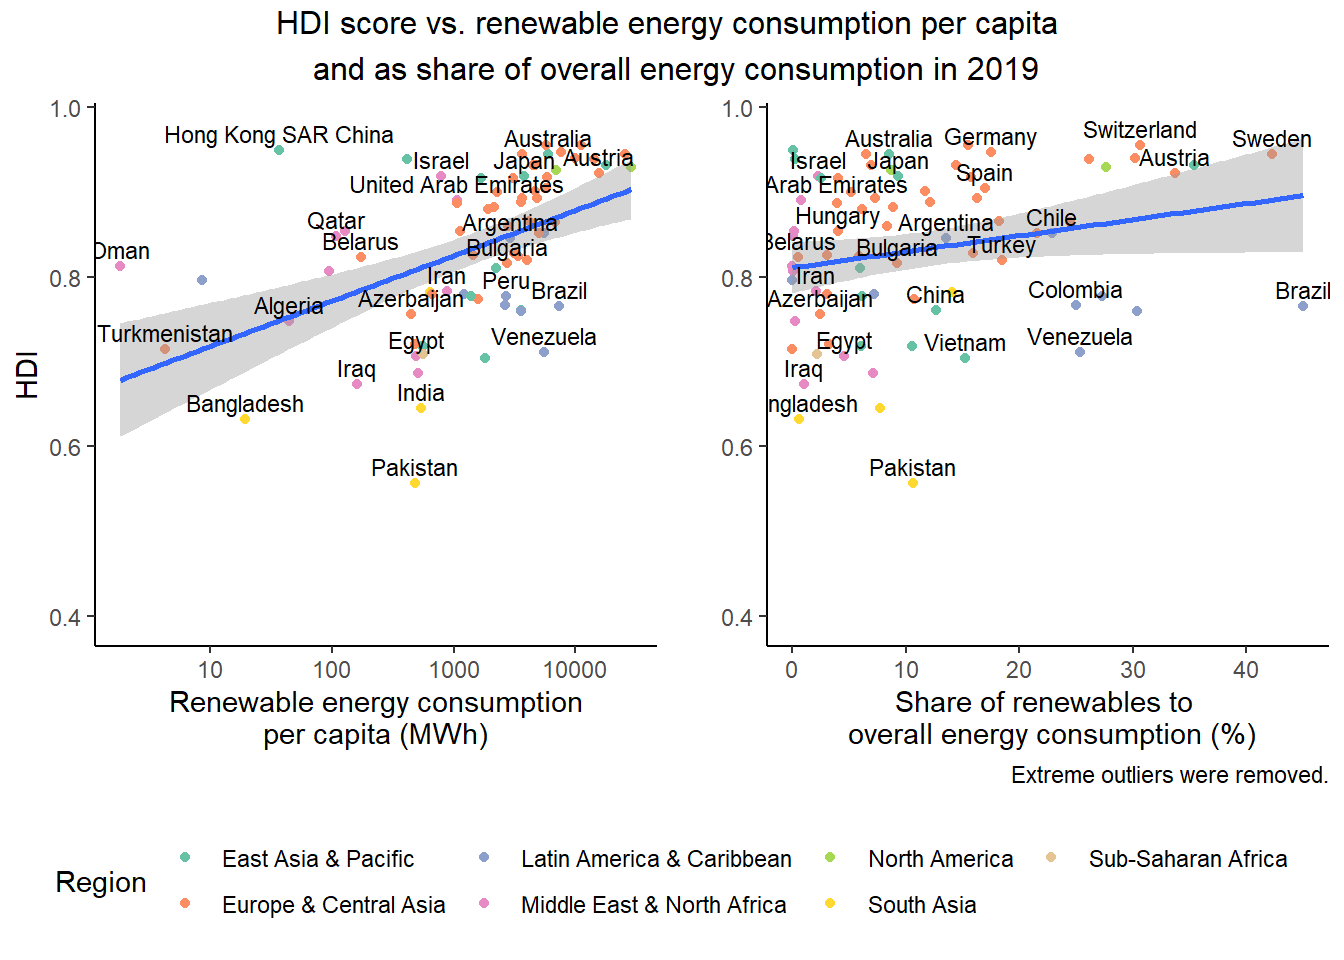 There is a positive correlation between HDI and renewable energy consumption both in per capita and in relative terms. However, we can also see that countries with a low share of renewable energy consumption like Hong Kong or Australia achieve high levels of human development. Generally, we can see that on a percentage-basis the most renewable countries are either in Europe or Latin America. Additionally, the left plot supports the idea that higher overall energy consumption correlates with human development. Nevertheless, we can deduct that more developed countries also invest more in renewable energy.
The following graph show the relationships, correlations and distribution between the HDI score, life expectancy, years of schooling, and the share of renewable energy compared to overall energy consumption.
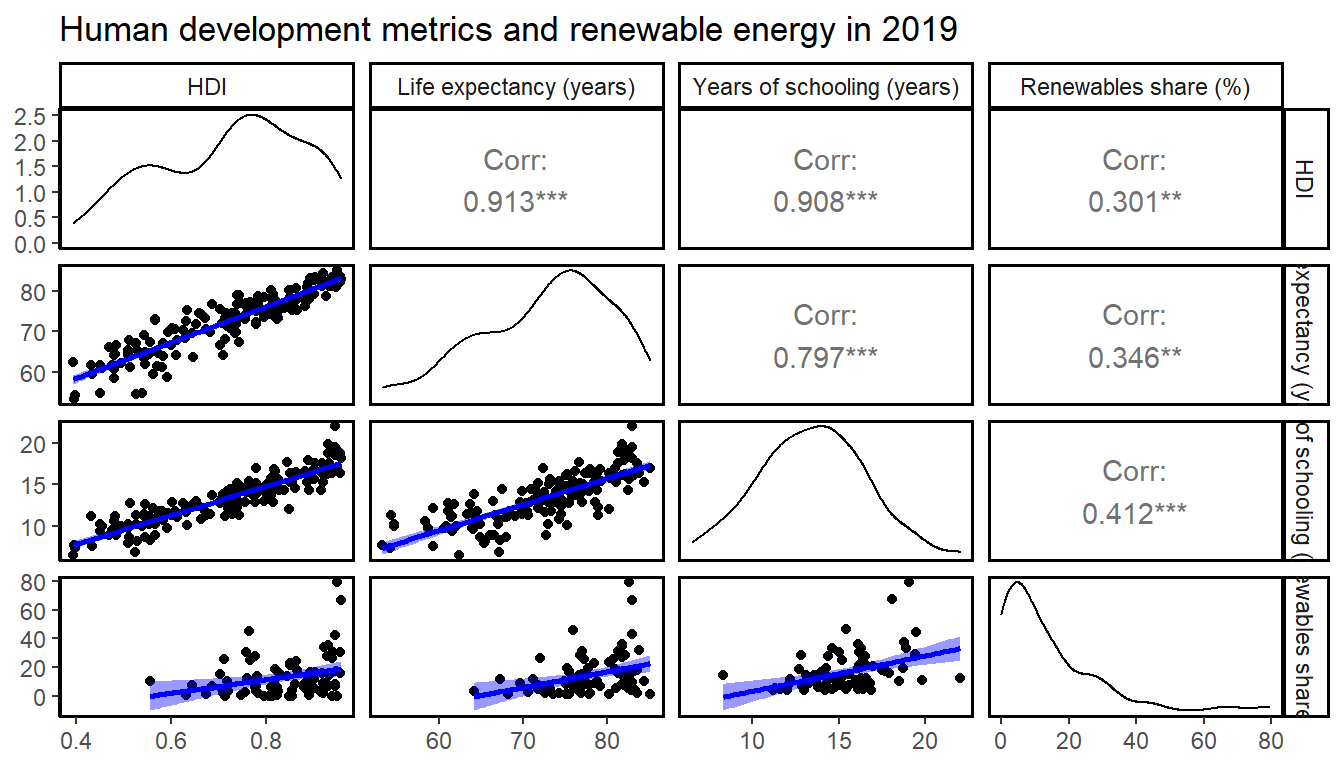 Countries with a high share of renewable energy are also those countries in which citizens have a higher life expectancy and receive more education. While life expectancy is left-skewed and years of schooling looks normally distributed, the share of renewables is strongly right-skewed. This indicates great room for improvement in investments into renewable energy.
5.4 Characteristics of countries with a high share of renewable energy
Now, we want to analyse countries that have a high share of renewable energy and what differentiates them from the rest of the world.
Countries and the share of renewable energy in their energy mixes
The countries with the highest share of renewable energy are Iceland, Norway, and Brazil. These and many other countries that have a high share of renewable energy have a long shoreline compared to the countries’ sizes.
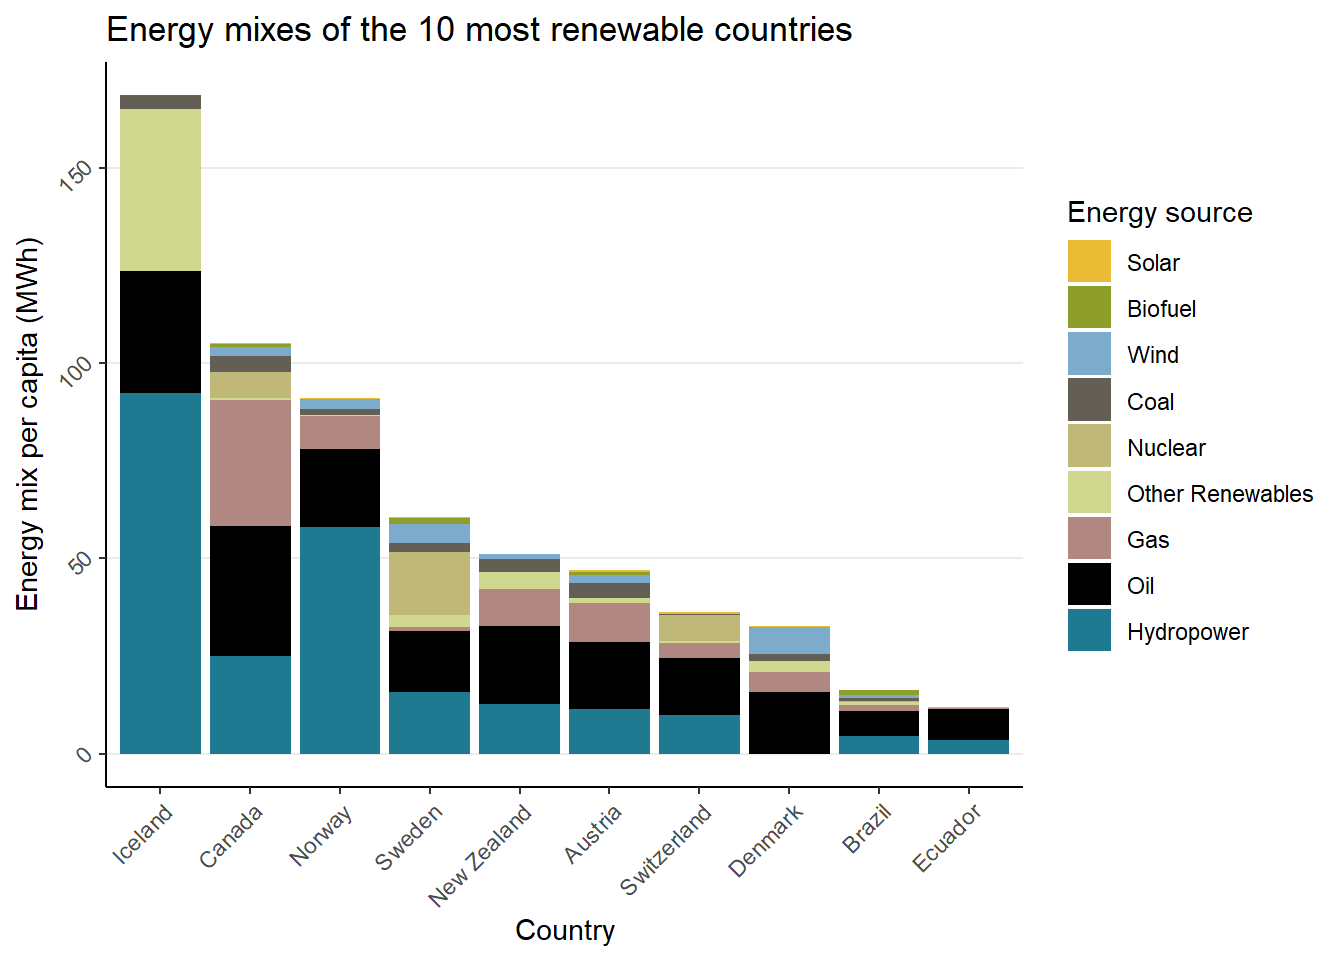 The most renewable countries rely on hydropower but also oil for a large share of their per capita energy consumption. While it is commonly assumed that renewable energies cannot reliably service a large energy demand, the example of Iceland indicates that this does not have to be true (of course considering political and geographical circumstances). Brazil and Ecuador are two poorer countries than the rest but manage to achieve a high share of renewable energy, further indicating that sustainable energy consumption is not only achievable for rich nations.
 The major difference between the top ten countries and the rest of the world is the share of hydropower. It is 23% higher than the one of the rest of the world. Additionally, the top ten countries use 24.6% less coal in their energy mix. Interestingly, wind, biofuel, and solar make up a very small share of the energy mix in all countries despite them being the ones that many countries put the most political attention to.
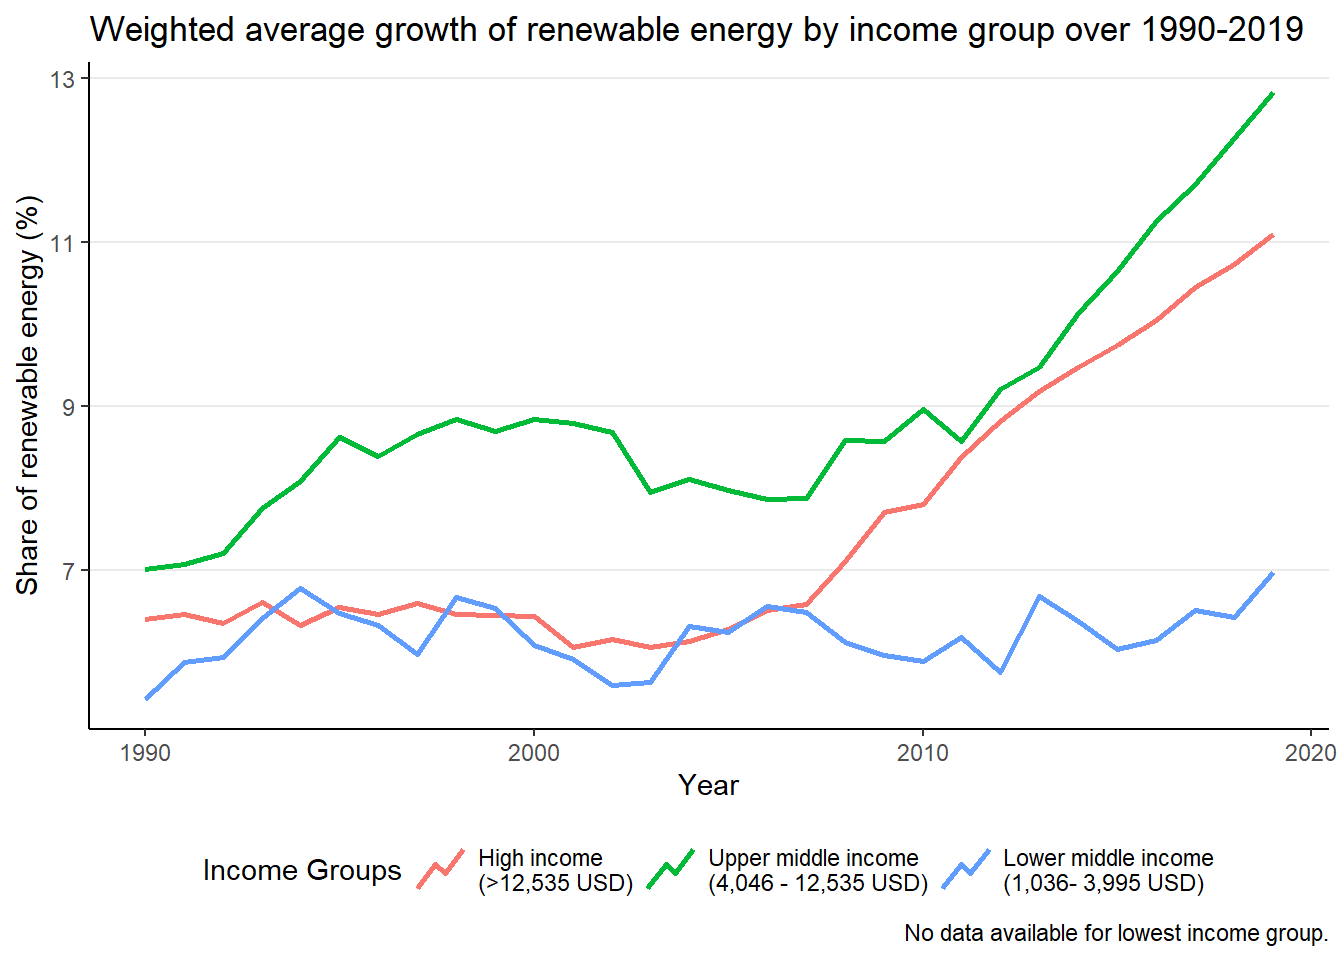 Contrary, to common expectation, not the richest countries but upper middle income countries grow their renewable energy quickest. Instead, populous upper middle income countries like Brazil, Turkey, and China, record steeper growth. Nevertheless, many upper-middle income countries do not currently increase their share of renewable energy. Albeit the average growth is slightly slower for high income countries, growth is more consistent across high income countries. An upward trend for all high-income trend could be identified. Lower middle income countries have only seen a slight uptick in recent years. On the one hand, countries like India and Venezuela slowly drive up the share of renewables. On the other hand, countries like Pakistan, Vietnam, or Sri Lanka have recently seen their renewable energy share drop drastically.